Estimating MV/LV DER Flexibility for Enhanced TSO–DSO Coordination: Insights from an Italian Real-World Case Study
 |
 |
||
|
Antonio Iliceto CIGRE Chairman of SC C1 (Power System Development & Economics) |
Chiara Vergine Terna Rete Italia Italy |
|
Alberto Berizzi Milano |
|
Alessandro Bosisio Pavia |
|
Davide Castiglioni Terna Rete Italia Italy |
Carmelo Mosca Terna Rete Italia Italy |
Andrea Morotti |
1. Introduction
The electricity system was originally conceived and developed with a unidirectional power flow and a vertically structured grid management approach. However, the necessary energy transition driven by the decarbonization of energy systems is creating growing challenges for the operation of electricity grids. The increasing penetration of distributed energy resources (DERs) in distribution networks could make it harder to overcome the grid's technical constraints. Nevertheless, DERs such as photovoltaic and wind power plants, cogeneration units, charging points equipped with V2G technology, and batteries could potentially provide system services, if aggregated effectively and if there were adequate coordination between transmission system operators (TSOs) and distribution system operators (DSOs). Currently, in the literature, there are only a few models for coordination between TSOs and DSOs, and no case studies on real networks; instead, they focus on test networks. Thanks to the participation of Terna (TSO side) and Unareti (DSO side), this paper proposes a simple coordination model that enables solving network constraints without exchanging sensitive data. Furthermore, it introduces a methodology for analyzing aggregated flexibility distributed according to the capability curves downstream of the DSO’s primary substations for short- and medium-term grid planning. The algorithm can access a limited database of non-sensitive data and, by applying statistical approaches, map the flexibility available at a primary substation. Finally, the code is used to study the flexibility available in the Milan area under a medium-term scenario.
2. Model for TSO-DSO coordination in short and mid-term
The challenges related to coordination between TSO and DSO are summarized below:
- Balancing the system: frequency and energy exchange control. The stochastic behavior of RES makes balancing more difficult.
- Congestion management: in tightly meshed systems (HV/HHV), it is more challenging than in radial systems (MV/LV) due to loop and transit flows. In the event of congestion, redispatching is the responsibility of the TSO, but this may change in the future, with the DSO being obliged to use and then dispatch flexibility resources connected to its own network, to solve network breaches
- Voltage control: this is performed in cooperation with conventional generation units; both TSOs and DSOs communicate directly with generator operators. Optimal reactive power exchanges between the TSO and the DSO can be achieved by specifying optimal power or reactive voltage control points at the point of common coupling (PCC).
- Controllability and observability of the DERs: enhancing the observability of the DSO network means increasing the exchange of data between the two entities so that the TSO can have a view of the power flows even on the network that is not under its jurisdiction to enhance dispatching activities.
Paper [4] first applies a customized capability curve to each type of DER source to represent its specific behavior and then aggregates them to the connection point in PS; paper [5]develops this concept by applying a time dependency to the aggregated capability, again dependent on the type of flexibility; these curves are then used by [6] in an OPF on the network to verify the possibility to supply/absorb active or reactive power to solve a network violation. Figure 2-1 shows a new coordination model, developed by combining and extending the information above.
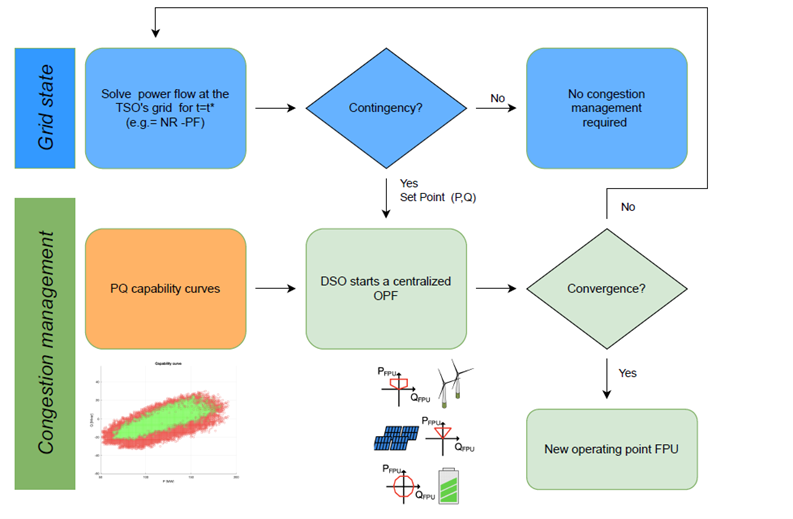
Figure 2-1: TSO-DSO coordination model
The model employs a top-down approach in which the TSO initiates an OPF on its network, and if a technical constraint is violated, the TSO formalizes a flexibility request to the DSO, specifying the new set point to be met. The TSO's set point to the DSO is a string of two variables (Pflex, Qflex). The following indices characterize the flexibility offer:
- Pupward: is the active power supplied by the DERs that can be fed into the DSO network; it is assumed positive.
- Pdownward: is the active power that may not be supplied by the DERs so as to decrease the active flows on the network; it is taken to be negative.
- Qupward: is the reactive power supplied by the DERs that can be fed into the DSO grid; it is taken as positive
- Qdownward: is the reactive power that can be absorbed by the DER; by convention, it is taken as negative
The OPF performed by the DSO can find (if possible) a new optimal operating point on the DSO's network that can compensate for the set points sent by the TSO to solve the congestion. If the algorithm cannot satisfy the TSO's request, the system sends the percentage it can relieve. The process described is an operational approach; however, standard flexibility curves (monthly, weekly, daily) can be implemented to account for variations in DER (e.g., day, night, summer, winter), providing a planned approach to TSO/DSO coordination. The advantage of this model is that the TSO and the DSO optimize their networks independently; thus, the exchange of data between the two entities concerns only the TSO's request to the DSO, without requiring the DSO to share sensitive information about its network with the TSO.
3. Methodology to obtain Capability curves
The strategy for obtaining the capacity curve of a specific source of flexibility is illustrated in Figure 3-1.
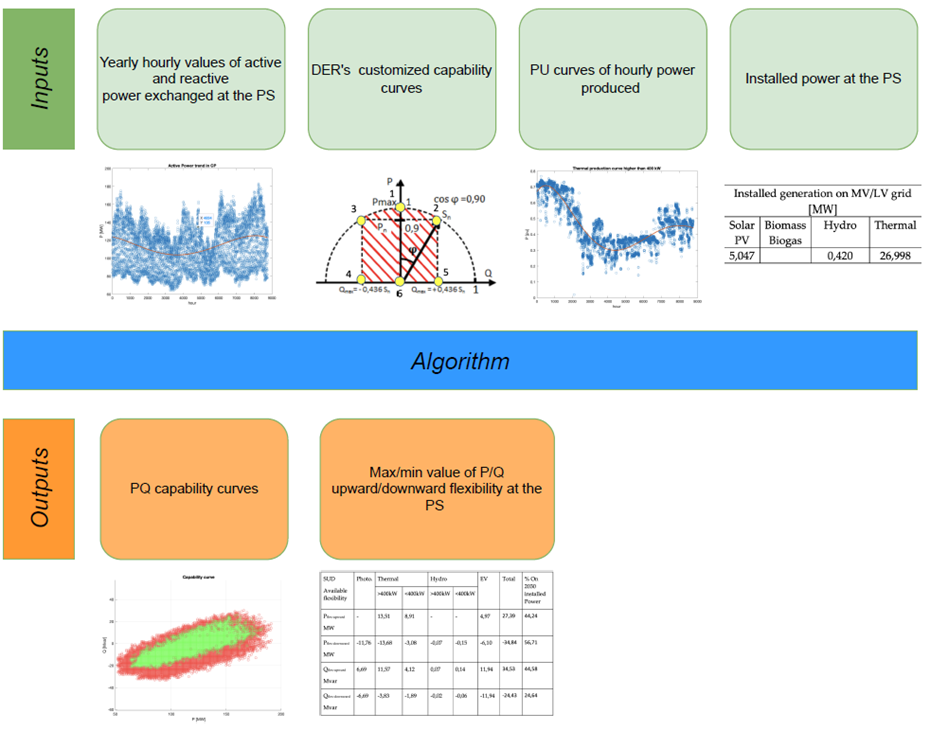
Figure 3-1: Capability curve flow chart
Terna ed Unareti provides the input data required for the model:
- Annual hourly values of active and reactive power exchanged in the PS; the value entered is the average of the two years for which data are available, i.e. 2020 and 2021.
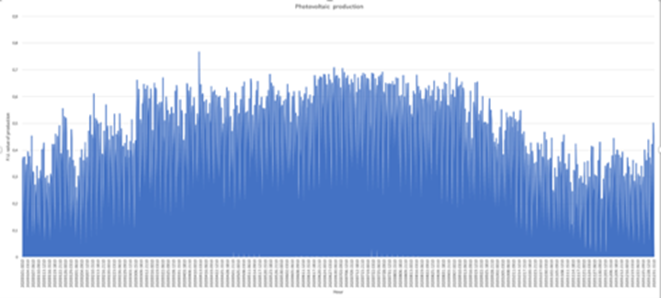
- Annual production curves per unit (PU). The curves are customized according to the type of resource considered. To obtain PU-fitting curves, some analyses have been carried out.
- Customized capability curve for each type of source, based on CEI 0-16 and CEI 0-21 standards.
- Installed power of each type of source downstream of the considered PS.
The capability curves, customized by DER type, are added to the P and Q values exchanged in PS to obtain a curve representing the grid's real power demand and possible additional margins of regulation. In Figure 3-2, the green points represent the as-is power exchanges in PS that already include AS-IS flexibility services, the red points represent the flexibility margin available in 2020, and the blue points represent the expected flexibility in 2030, calculated by interpolating the scenarios described above. From Figure 3-2, it is easy to see how flexible services influence the values measured in PS.
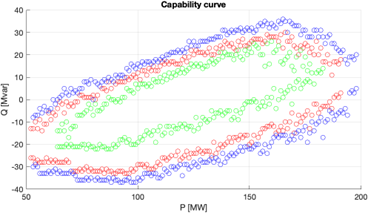
Figure 3-2: Total Capability curves limits on PS
- Photovoltaic Power Plants
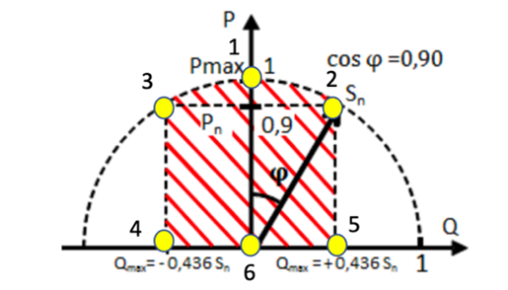
The CEI standards state that for static generators, the inverter capability curve must have a "limited half-circular" shape, with cosf between 0.9 in absorption and 0.9 in output, resulting in six operating limit points; Figure 3-3 shows the operating points implemented in the code. The photovoltaic cannot provide Pupward, however, it can provide reactive power even when no active power is produced. The annual PU production curves are shown in Figure 3-4.
 |
 |
||
| Figure 3-3: capability photovoltaic curve | Figure 3-4: PU average photovoltaic production |
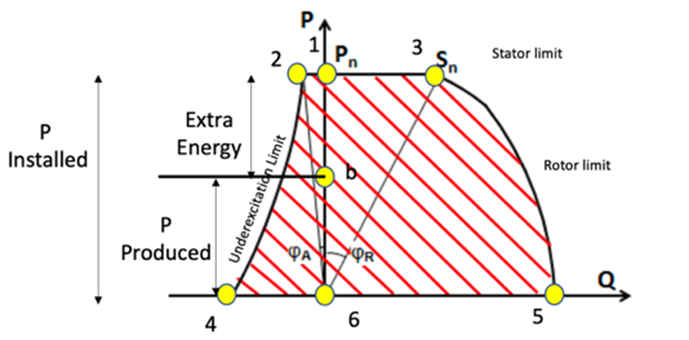
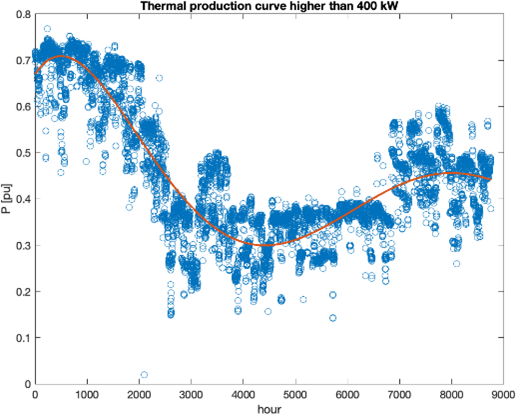
- Thermal Power Plants
The customized capability curve for the thermal source is shown in Figure 3-5. Unlike solar, where the active power is not adjustable but determined by the light radiation, with a thermal source, it is possible to activate a further portion of active power, which, for simplicity, is called extra-energy, equal to the difference between the installed power and the produced power. In CEI 0-16, a distinction is made between installed power greater or less than 400 kW, this distinction has been considered in the code. Annual PU production curves for installed power higher than 400 kW is reported in Figure 3-6.
 |
 |
||
| Figure 3-5: capability thermal curve | Figure 3-6: P.U. fitting curve |
- Hydroelectric Power Plants
A capability curve similar to that of the Thermal Power Plants is considered, but since hydro production depends on water availability, it is assumed to have no extra energy.
- Electric vehicle EV
V2G technology enables feeding the energy from the car battery into the grid, allowing all quadrants to be utilized. It is assumed that the nominal apparent power equals the active power required in a specific hour. The capability curve is shown in Figure 3-7
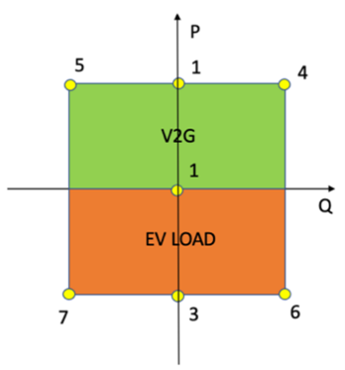
Figure 3-7: capability EV curve
4. Result for PS Milano SUD 2030
The proposed approach identifies, for each hour, the maximum flexibility variations (Pflex upward/downward; Qflex upward/downward). Specifically, it calculates these values for all points that define the capability curve of each type of DER. The algorithm then selects, among these, the maximum and minimum variations with respect to the measured power values at the PS. Table 3-1 reports the maximum flexibility values achieved in 2030, along with the corresponding contributions from each DER source.
|
Available flexibility |
Photo |
Thermal |
Hydro |
EV |
Total |
||
|
>400kW |
<400kW |
>400kW |
<400kW |
||||
|
Pflex-upward MW |
- |
13,51 |
8,91 |
- |
- |
4,97 |
27,39 |
|
Pflex-downward MW |
-11,76 |
-13,68 |
-3,08 |
-0,07 |
-0,15 |
-6,10 |
-34,84 |
|
Qflex-upward Mvar |
6,69 |
11,57 |
4,12 |
0,07 |
0,14 |
11,94 |
34,53 |
|
Qflex-downward Mvar |
-6,69 |
-3,83 |
-1,89 |
-0,02 |
-0,06 |
-11,94 |
-24,43 |
Figure 3-8 reports the maximum flexibility trend upward and downward for active and reactive power during the year; reactive power due to adjustments on machines and inverters remains constant throughout the year. Instead, by looking at active power during winter months, since thermal production is higher, Pupward is smaller than during summer, so in winter there is only a contribution from EVs; referring to Pdownward, there is only a substantial contribution from photovoltaics that support this trend during summer, when thermal plants work less. The contribution of hydro power plants in the PS considered is scarce.
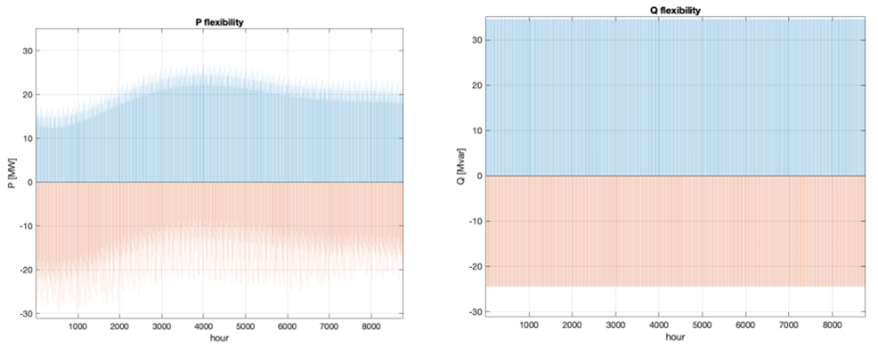
Figure 3-8: Total P,Q flexibility available
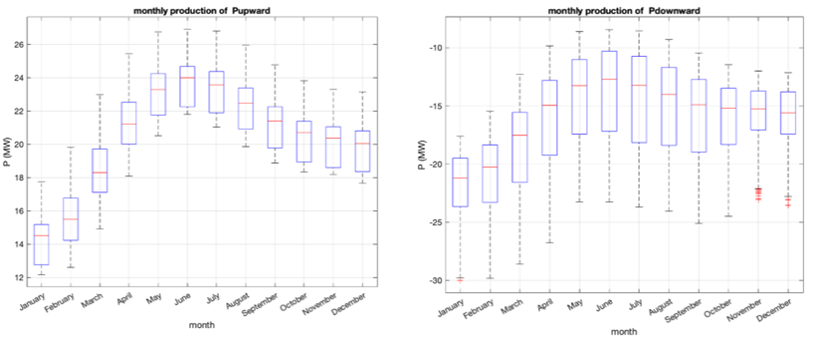
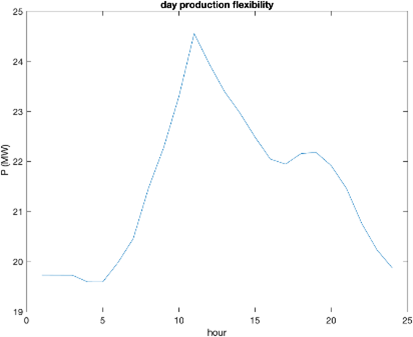
To pursue the goal of programming the network and thus to provide curves and values showing a typical trend, in addition to the results obtained above, the proposed approach can report more detailed information, such as monthly flexibility (Figure 3-9), daytime hours – nighttime hours trends, or daily flexibility (Figure 3-10).
 |
 |
||
| Figure 3-9: Pupward and Pdownward monthly flexibility | Figure 3-10: daily variation of Pupward |
In Figure 3-11, a statistical normal distribution is applied to the 2030 flexibility values obtained from the code, representing the probability of having a specific flexibility value during the year. It can be observed that, since thermal exploits the installed capacity for only a few months per year, the upward flexibility it can provide is considerable and substantial, approaching the maximum (27,39 MW in the real case).
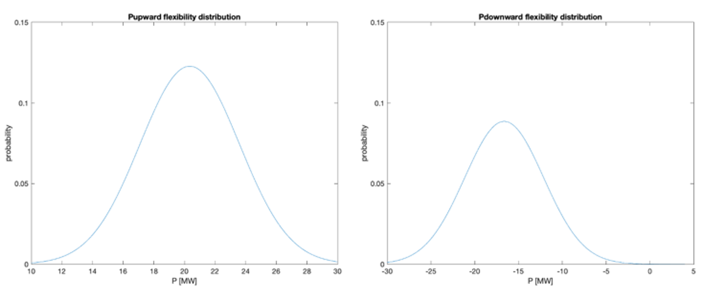
Figure 3-11: 2030 Pupward/ Pdownward probability distribution
5. Case study
The methodology proposed in the previous chapter is applied to all primary substations (PSs) in Milan to determine whether DERs installed within Unareti's distribution network can address constraints on the transmission grid. To establish meaningful flexibility thresholds from the TSO perspective, the following minimum values are considered:
- 10 MVAR of reactive power variation on a PS is required for an appreciable voltage variation at the same PS. For example, in a low load situation, a 10 MVAR variation on a PS in the Milan area can cause a voltage variation of approximately 0.5 kV on the 220 kV busbars of the same PS, according to Terna's simulations.
- 10 MW is the minimum active power variation on a PS necessary for an appreciable change in power flows on the lines departing from it.
Based on these planning objectives, the maximum flexibility values for each offer in 2030 are presented in Table 4-1.
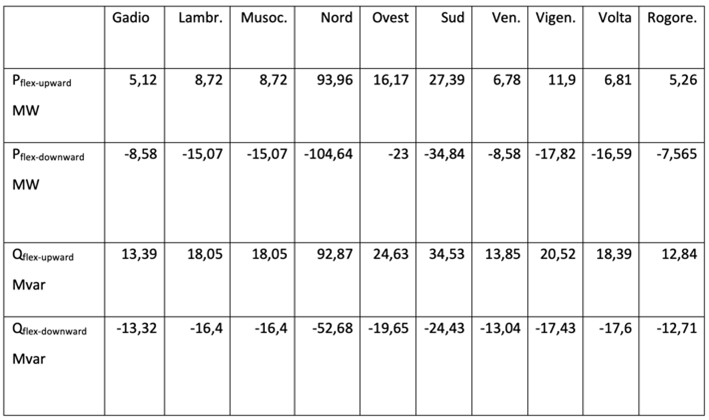
Table 4-1: PSs flexibility offers
The 2030 availability of downward active power from the various primary substations (PSs) is detailed in Figure 4-1. This representation makes it easier to observe how the flexibility offer is highly diversified among the PSs, and highlights that some of them do not reach the minimum threshold of -10 MW required to provide a concrete contribution to the TSO. The figure also clearly shows the contributions of the different DERs.
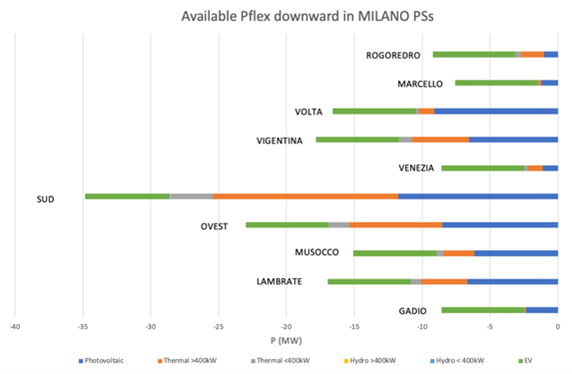
Figure 4-1: Available Pflex downward in PSs
Conclusions
The results indicate that not all DERs aggregated under each PS in the Milan area can provide flexibility services to the TSO. In particular, DERs could effectively support voltage regulation at most nodes through a significant increase in reactive power exchange, either by injecting or absorbing reactive power from the grid. However, regarding active power, in most PSs, DERs can assist the TSO mainly by reducing their generation output, thereby helping to manage potential power surpluses on the national grid. The injection of additional active power into the network is limited by the low Pupward values and the weak sensitivity observed at the PCC.
Nevertheless, aggregating DER capabilities remains valuable to the TSO, as it enables a clearer assessment of flexibility at the DSO level and supports future system planning. Further developments of this work could include extending the analysis to account for storage systems, STATCOMs, HV/MV transformer tap-changers, and network reconfiguration in the overall flexibility potential. Moreover, the influence of DERs on specific network zones could be characterized through area sensitivity analysis.
References
[1] Terna. Codice di Rete 2025
[2] Terna. Piano di Sviluppo 2025
[3] Unareti. Piano di Sviluppo 2025
[4] D. A. Contreras, K. Rudion.Improved Assessment of the Flexibility Range of Distribution Grids Using Linear Optimization. IEEE. 2018
[5] D. A. Contreras, K. Rudion.Time-Based Aggregation of Flexibility at the TSO-DSO Interconnection Point.IEEE. 2019
[6] S.Muller, K. Rudion. Improved Congestion Management Using Aggregated Flexibility at the TSO-DSO Interface. IEEE. 2021.